Model Specification
Importance in education research
Model specification is the process by which variables are selected to be included in a model (MacCallum, 1995). There is a tension in model specification between including all relevant variables and conserving statistical power. A range of methods to specify models have been developed to create the most accurate and parsimonious models possible. In DBER, the most common method is using p-values, while data scientists tend to use information criterion. The p-value method generally creates more parsimonious models that include fewer variables. The variables included in a model drive what research questions can be answered and the conclusions drawn from them.

Equity issue
Equity DBER models, particularly those that examine intersectionality, often rely on interaction effects to identify differences across demographic groups. When using a model specification method that is strongly reliant on sample size (e.g., p-values) any variable that does not have a large sample is removed. This often leads to the removal of variables that model outcomes for the most marginalized groups (e.g., women of color). Removal of variables that could expose inequities in student outcomes has led some researchers to conclude that there are no inequities for those groups (e.g., Salehi et al., 2019; Alzen et al., 2018).
When creating a regression model one must decide which variables to include and which to exclude. Each variable that is included in a model allows the model to control for more factors, but they also use up statistical power. For these reasons, we aim to include variables that are important to our research questions but exclude those that do not improve the fit of the model. These competing concerns of model fit and parsimony have led to a number of methods for selecting a final model. In this section we will review the pros and cons of several methods and make recommendations for how to select models when engaging in equity research.
We begin with a quick summary of the pros and cons of each method before going into more detail about each method. We conclude with example of the difference that can arise from using each of the three methods.
PROS | CONS | RECOMMENDATIONS | |
|---|---|---|---|
Statistical significance | Easy to perform, Commonly used | Undervalues variables about minority populations, Perpetuates misunderstandings about p-values | Do not use |
Variance Explained | Easy to perform | Undervalues variables about minority populations | Acceptable to use if there is balance in demographic group representation |
Information Criterion | Balances model fit and parsimony | Requires more statistical analysis (but there are stats packages to make it easy) | Best method in all cases |
Method #1: Statistical significance
What it is:
Tests of statistical significance is a measure of the likelihood of an outcome occurring assuming the null-hypothesis were true. Measures are typically deemed statistically significant if the p-value ≤ 0.05. For more information on why the use and interpretation of p-values is problematic see our page on statistical significance.
How it is used:
There are variations on the exact methods of using statistical significance in model selection but they all hinge removing predictor variables with coefficients that have p-values over 0.05. This can be done with incremental addition and testing of predictor variables or creating a large model and then incremental removal of variables.
Pros:
It offers a method for creating parsimony in the model and is a commonly used method that will go largely unquestioned by reviewers.
Cons:
The use of statistical significance is problematic on many levels. These problems are exacerbated when creating models to examining issues of equity because datasets often lack statistical powers, particularly for modeling outcomes of marginalized groups. The use of statistical significance is likely to lead to the removal of predictor variables that are good predictors for marginalized groups simply because their population is underrepresented in the dataset.
Verdict:
This method should not be used under any conditions.
Method #2: Variance explained
What it is:
Variance is a measure of how far each data point in the data set is from the model’s predicted value for that data point. The better a model fits the data, the lower the variance value is. In hierarchical models there is a variance value for each level of the model (for more information see our page on nested data sets). Variance explained is then the % decrease in the variance value from the model with no predictor variables (called the unconditional model) and the model being tested.
How it is used:
Variance explained is often used for model selection by adding variables to the model one at a time. As each variable is added the variance explained is compared to the model prior to its addition. If the model explains at least 1% more of the total variance than the prior model then the variable is kept. If not, it is removed. This process continues until all variables of interest are exhausted.
Pros:
It’s a simple and commonly method that takes into account both the explanatory power of the model and the parsimony of the model.
Cons:
The method is somewhat crude and when examining issues of equity it is likely to remove many variables of importance. For example, if looking at outcomes for physics students it is likely that less than 1% of the data will come from women of color. Therefor any variable that directly accounts for the groups outcomes (e.g., gender x race) is very unlikely to account for 1% of the total variance, even if it’s a great predictor for women of color. The underrepresented nature of marginalized peoples leads variables about them being caught up in the parsimony filter.
Verdict:
It’s a better method than using statistical significance but is still inferior to using information criterion, particularly when examining data with unbalanced population representation.
Method #3: Information Criterion
What it is:
There are a number of information criterion methods, but the most commonly used are Akaike information criterion (AIC) and Bayesian information criterion (BIC). Both of these methods calculate a score that reflects two factors: the fit of the model and the model’s parsimony. The fit of the model is estimate using a maximum likelihood function and the parsimony is addressed by a penalty factor based on the number of explanatory variables used. For investigations of equity, we generally recommend AIC over BIC as it has a lower penalty for model parsimony.
How it is used:
An information criterion value is calculated for all potential models of interest. The values for each model are then compared to each other. Any model that has a score that is within 2 of the lowest score is considered to have substantial evidence for the model. Models with scores that are 3-7 higher than the lowest score have less support for the model. Models with scores that are 10+ higher than the lowest score are unlikely to be good models. Researchers can then select a model that is within 2 of the lowest information score that best speaks to their research questions knowing that there is good empirical support for its use.
Pros:
Information criterion accounts for model fit and parsimony in more sophisticated ways than statistical significance and variance explained. The statistics community generally recommend the information criterion be used when selecting models. Information criterion are more likely to lead to the inclusion of variables that address populations that are underrepresented in a dataset.
Cons:
Calculating AIC or BIC scores for all possible combination of variables of interest can be time consuming. There are, however, R functions (e.g., dredge) that automate the process.
Verdict:
Information criterion are superior to statistical significance and variance explained for model selection, particularly when examining issues of equity. Different information criterion can be used to adjust levels of parsimony.
AN EXAMPLE
We analyzed the data set of student gains on introductory physics concept inventories that was used in Van Dusen & Nissen (2019). The dataset was collected by LASSO and included data from 13,857 students in 187 first-semester college physics courses. We used all three methods of model selection to identify the “best” model. For details on what multi-level models, see our multi-level model page.
METHOD | VARIABLES INCLUDED |
|---|---|
Stat. Sig. | Race, gender, and instruction type |
Var. Expl. | Race, gender, instruction type, and race*gender |
Inf. Cri. (AIC) | Race, gender, instruction type, race*gender, race*instruction type, gender*instruction type, and race*gender*instruction type |
For each of these methods we will show a figure with the predicted gains in a lecture-based course and a figure for the improvements in predicted gains in collaborative-based courses.
Figures for the statistical significance model selection method.
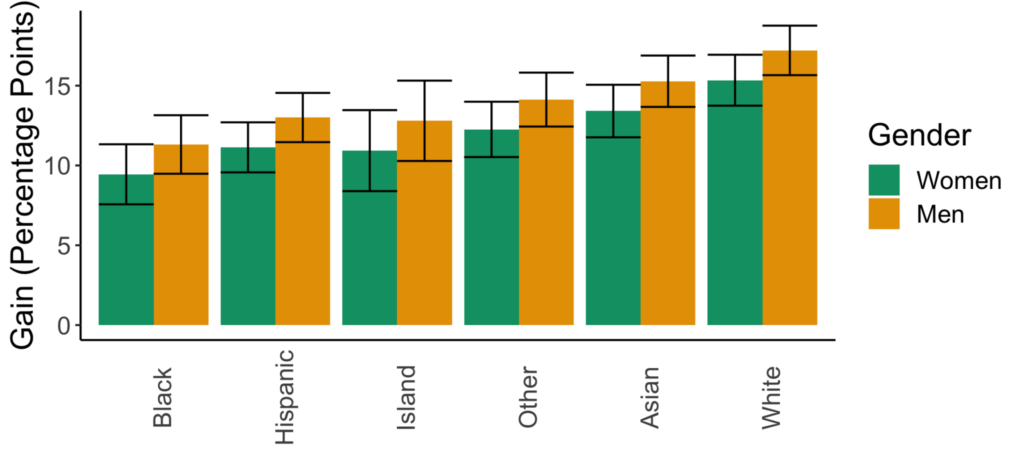
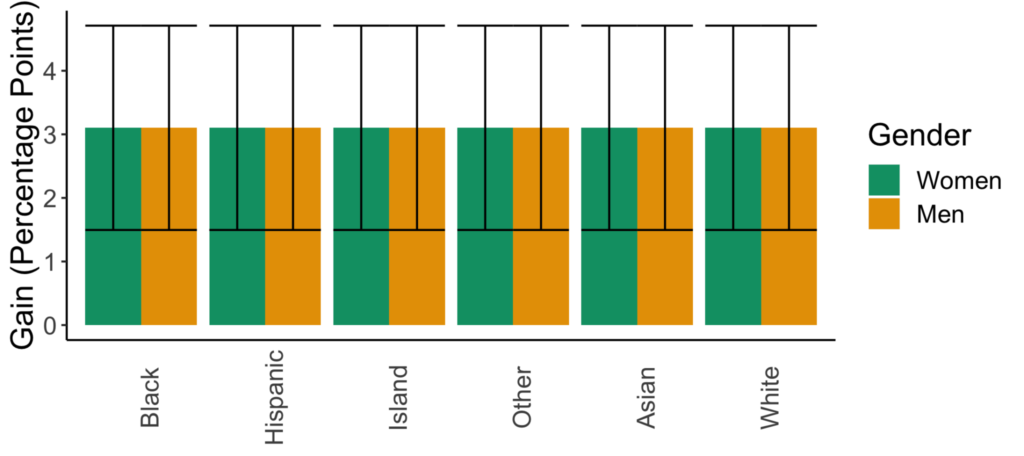
There is no variation in the predicted impacts of sexism across races. There is also no variation in the impacts of going from lecture- to collaborative-based learning across racial or gender groups.
Figures for the variance explained model selection method
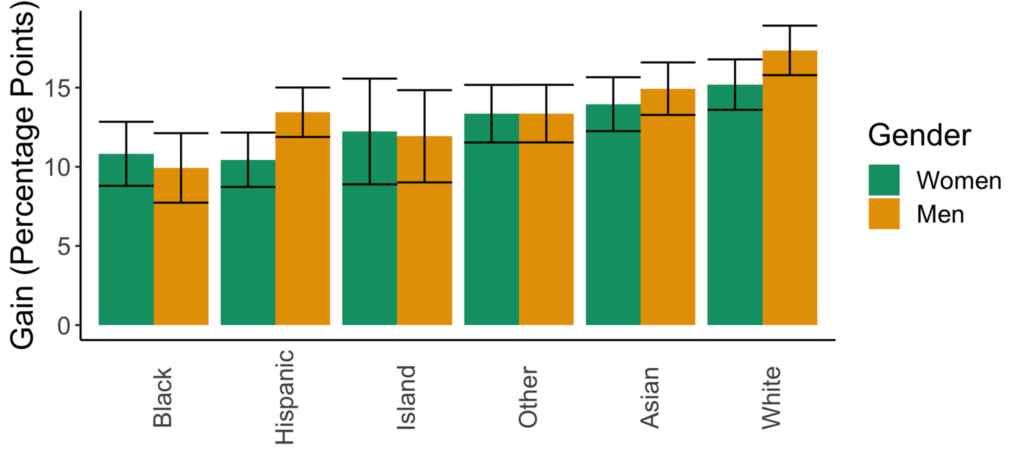
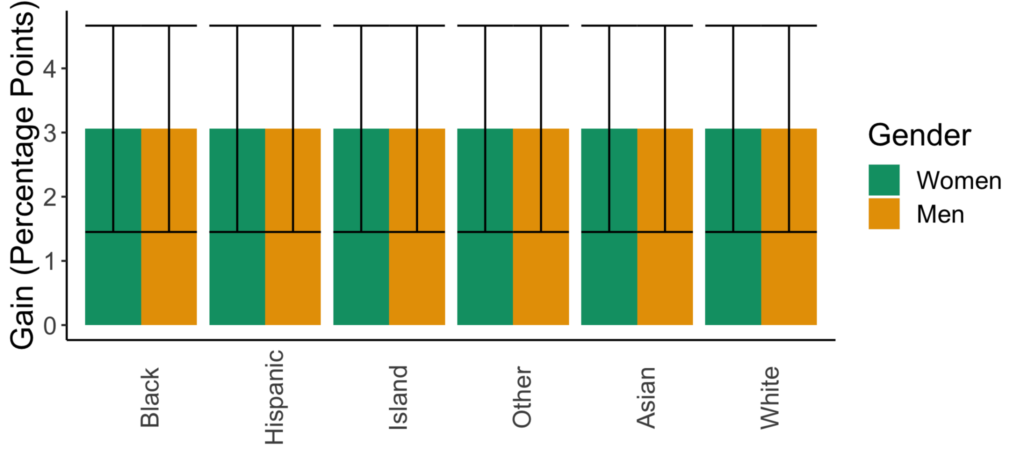
There are now variations in the predicted impacts of sexism across races. There is, however, still no variation in the impacts of going from lecture- to collaborative-based learning across racial or gender groups.
Figures for the information criterion (AIC) model selection method
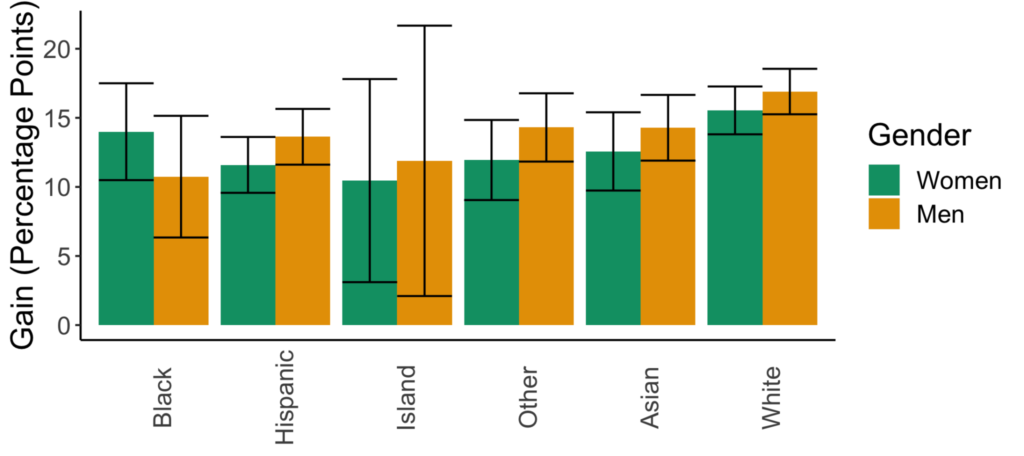
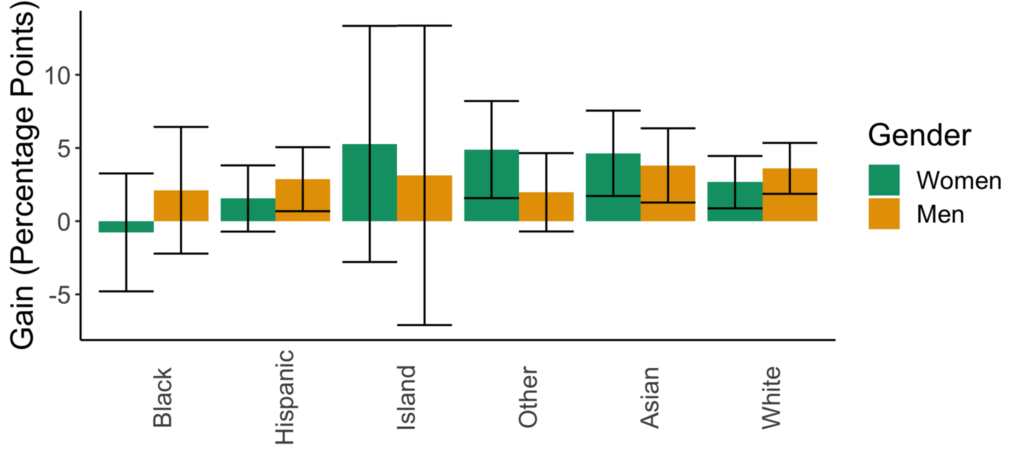
There are now variations in the predicted impacts of sexism across races as well as in the impacts of going from lecture- to collaborative-based learning across racial or gender groups. While the confidence intervals are larger in this model, it is just a representation of the ability of the dataset and model to explain student outcomes.
SUPPORT STEM EQUITY
STEM Equity is continuously adding to our personal and professional resources and partners in the mission of equitable STEM education.
If you know of an organization we should know about or partner with, or would like to support STEM Equity’s mission, please contact us.