Skip to content

Data Visualizations

How We Visualize Data

Examples of data visualizations include barplots, box plots, scatter plots, histograms, and density plots. Data visualizations should:

  • Show the raw data
  • Not conceal information
  • Check the pattern of distribution of the data
  • Take care when the samples are small
  • Present appropriate measures of precision or dispersion

Drummond, G. B., & Vowler, S. L. (2011). Show the data, don’t conceal them. British journal of pharmacology, 163(2), 208–210. https://doi.org/10.1111/j.1476-5381.2011.01251.x

Conceal Data

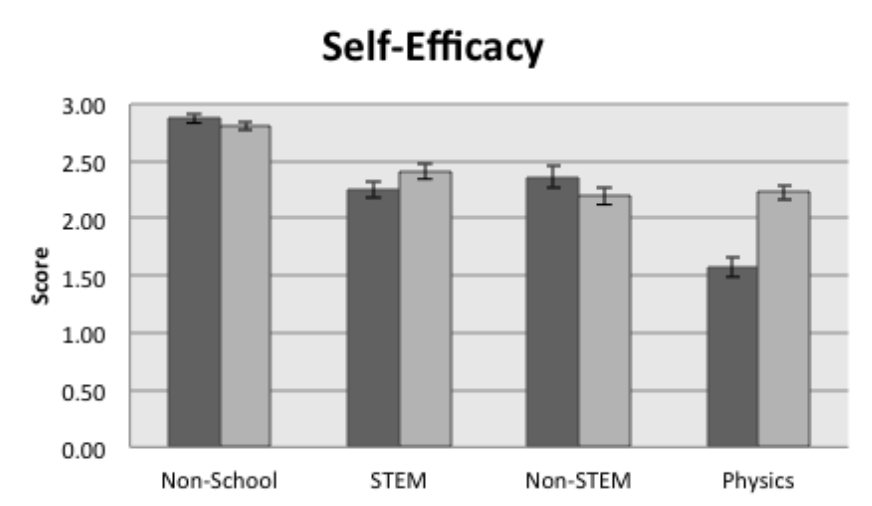
A very common representation in the scientific literature, dynamite plots represent the mean as a bar extending from the axis with a line to represent either the standard error or standard deviation.

Dynamite plots:

  • Conceal the amount of data being represented,
  • Conceal the distribution of the data,
  • Obscure meaningful differences by always extending to the axis, and
  • Provide no additional information to a table.

A dynamite plot from Nissen & Shemwell, PhysRevPER, 2016.

Combined Plots

Scatterplots support readers in evaluating the statistical tests used, whether the data met assumptions for those statistical tests, and to critically think about the authors interpretations of those data.
 

Scatter Plots

Scatterplots support readers in evaluating the statistical tests used, whether the data met assumptions for those statistical tests, and to critically think about the authors interpretations of those data.

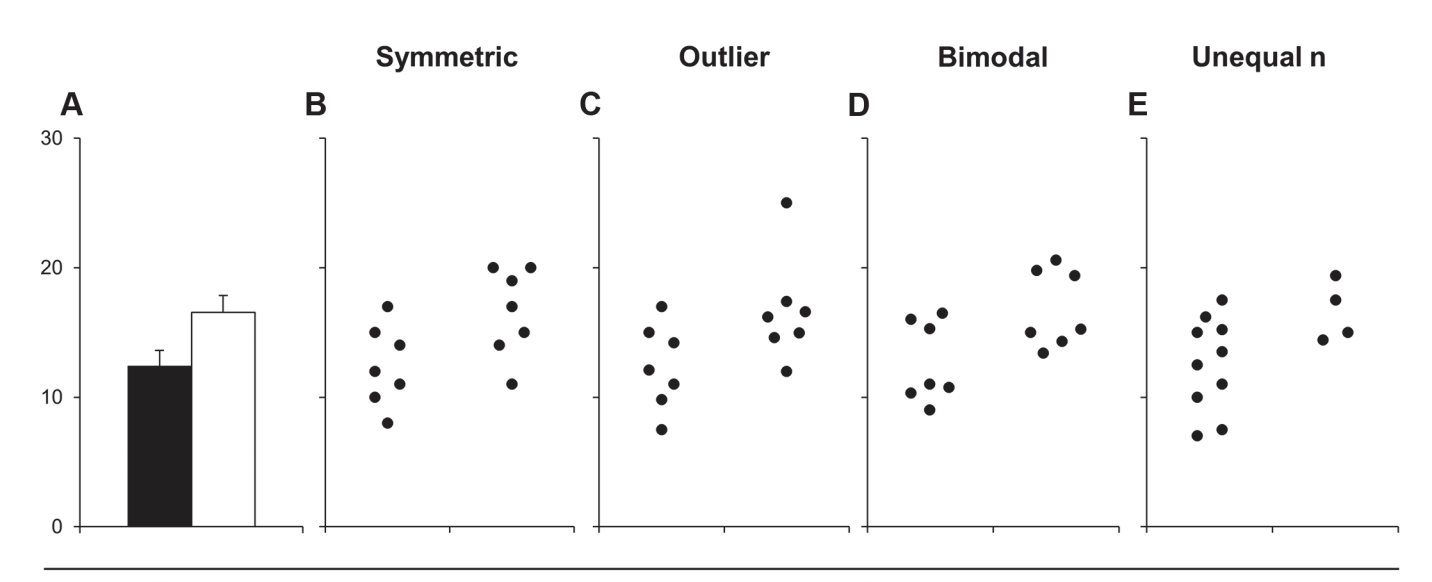
Scatterplots show each point of data. The points are shifted left and right small amounts (jittered) to minimize the overlap in the points so that all of them can be seen.

Scatterplots:

  • Show how much data there is,
  • Show how the data was distributed,
  • Can become overwhelmed when large amounts of data are presented, and
  • Can be difficult to estimate the means or medians when large amounts of data are presented.

Violin Plots

Violin plots present two reflected density plots in a way that overlaps well with the box plots and scatter plots. Violin plots allow comparing the distributions of two data sets with very different sample sizes.
Violin plots overlayed on scatter plots showing how instruction can eliminate, maintain, or increase society’s educational debts.
 
A violin plot presents the probability of finding a data point. The whole area of the violin plot adds up to 2. Two because it is two density plots. The proportional area over a range represents the probability of finding a point in that range.

Before modern computers, scientists would draw their violin plot on thick paper. They would cut out the violin plot and weigh it. Then they would cut out the range of the violin plot they were interested in and they would weigh that. The ranges weight divided by the total weight is the probability of finding a point in that range.

Violin plots:

  • show the distribution of the data independently from how much data there is,
  • do not indicate how much data there is, and
  • can be difficult to estimate the means or medians when the data is not symmetric.

Box plots with notches

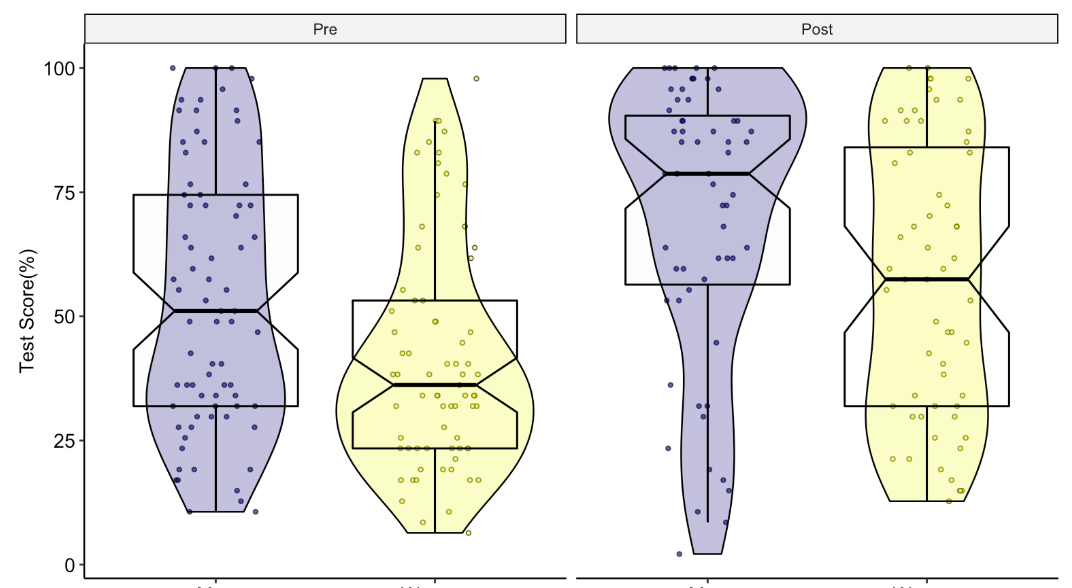
Box plots show the median, inter quartile range, and outliers. We use notched boxplots that show the 95% confidence interval of the median. If the notches of two boxplots do not overlap then the difference is larger than the uncertainty in the measures.
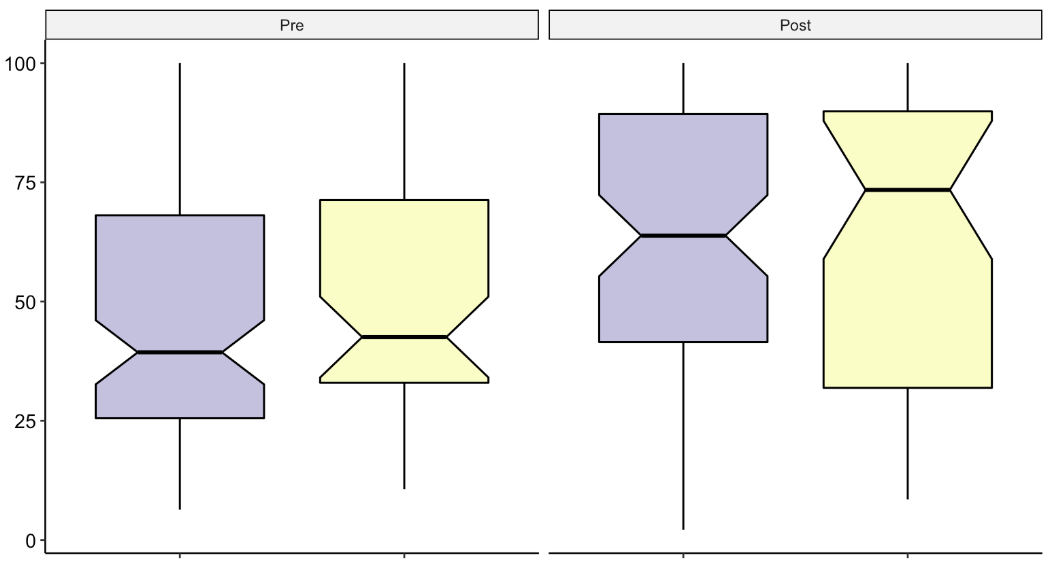
Box plots:

  • Indicate the summary statistics (i.e., the median and interquartile range),
  • Reveal outliers,
  • Reveal skew,
  • Hide some types of data distributions (e.g., bimodal),
  • Provide a precise measure of the uncertainty (i.e., the notches), and
  • Do not reveal how much data they describe.

Combining all three

  • Scatter plots show the data.
  • Violin plots show how the data was distributed.
  • Box plots show the descriptive statistics for the data.

SUPPORT STEM EQUITY

STEM Equity is continuously adding to our personal and professional resources and partners in the mission of equitable STEM education.

If you know of an organization we should know about or partner with, or would like to support STEM Equity’s mission, please contact us.