- Ronald L. Wasserstein & Nicole A. Lazar (2016) The ASA Statement on p-Values: Context, Process, and Purpose, The American Statistician, 70:2, 129-133, DOI: 10.1080/00031305.2016.1154108
- Gigerenzer, G. (2004). Mindless statistics. The Journal of Socio-Economics, 33(5), 587-606.
- Valentin Amrhein, David Trafimow & Sander Greenland (2019) Inferential Statistics as Descriptive Statistics: There Is No Replication Crisis if We Don’t Expect Replication, The American Statistician, 73:sup1, 262-270, DOI: 10.1080/00031305.2018.1543137
- Ronald L. Wasserstein, Allen L. Schirm & Nicole A. Lazar (2019) Moving to a World Beyond “p < 0.05”, The American Statistician, 73:sup1, 1-19, DOI: 10.1080/00031305.2019.1583913
- Nuzzo, R. (2014). Scientific method: statistical errors. Nature News, 506(7487), 150.
- Stage, F. K. (2007). Answering critical questions using quantitative data. New directions for institutional research, 2007(133), 5-16.
Moving Beyond P-values
P values are not go/no-go tests.
By Jayson M. Nissen
P values are not go/no-go tests. On their own, they cannot determine if a relationship is important. As the American Statistical Associations Statement on P values [1] states, “Scientific conclusions and business or policy decisions should not be based only on whether a p-value passes a specific threshold.” Gigerenzer [2] in his article “Mindless Statistics” argues that using null hypothesis significance testing to generate and interpret p values is a statistical ritual that eliminates statistical thinking. In the realm of equity work, p values are particularly problematic because they depend on sample size and lead to selective reporting and selective attention that can ignore injustices borne by the most underrepresented and marginalized groups of students.


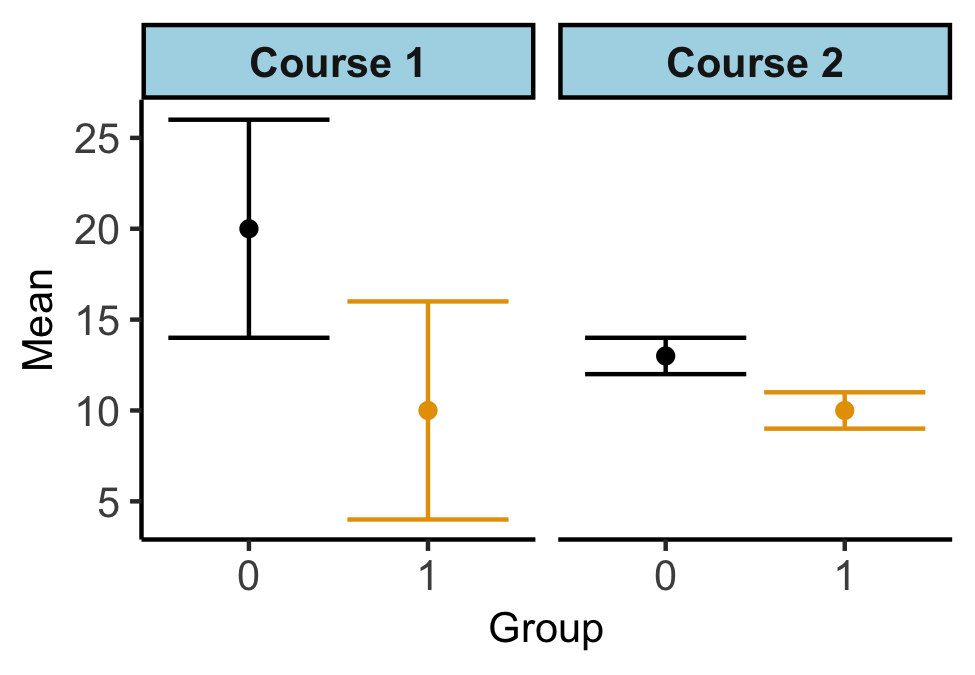
FIG. 1: An example data set comparing two groups in two different courses measured with the same instrument. Course 1 illustrates a much larger difference that but we cannot be as confident about the magnitude of this difference because of the larger overlapping error bars, which represent 1 standard error. Course 2 illustrates a much smaller difference that we can be very confident is different and is small. Differences in uncertainties often result from differences in sample sizes.
Issues with p values are addressed in depth by a recent collection from The American Statistician titled “Moving to a world beyond ‘p<0.05’ ” [4] and Regina Nuzzo’s “Scientific Method: Statistical Errors” [5] provides a concise introduction to issues with how p values are used in the sciences. Based on these critiques of p values and motivated by the CritQuant [6] framework for our research, we have moved away from using p values in our research. Instead of using p values, we used the overlap in the standard errors of the point estimates to inform our confidence in the results by indicating how compatible the model was with the data. Figure 1 provides an example data set illustrating two courses. In course 1, the model indicates there may be very large differences between the groups. However, we cannot be very confident about the size of that difference. In course 2, the model indicates small differences between the groups and that we can be very confident both that the two groups are different and that the difference is small. The difference in the size of the error bars often results from a difference in sample size. P values combine the size and uncertainty in the differences into one measure and therefore obscures the distinction between the two. By evaluating both the size of the difference and our uncertainty in that difference, we avoided the common incorrect practice of treating p values as binary indicators of significance.
References
SUPPORT STEM EQUITY
STEM Equity is continuously adding to our personal and professional resources and partners in the mission of equitable STEM education.
If you know of an organization we should know about or partner with, or would like to support STEM Equity’s mission, please contact us.