By Jayson Nissen
Researchers often present statistical analyses as trivial to both do and present. In my own experience, I can generally watch a short video and then run statistical tests I see in papers just using Excel. It outputs a p-value and I’m off to the races. Statistical tests, however, are full of problems and pitfalls. Researchers have multiple ways of manipulating the results of these tests, and most scientific journals don’t require sufficient transparency to allow reviewers and readers to catch errors or malfeasance. My courses in physics provided few opportunities for learning statistical methods from actual statisticians. I, subsequently, relied on what was published within physics education research and feedback from my advisors and mentors to piece together an understanding of statistical methods. Drawing from a wide range of fields to help with a number of analytical quandaries,we have slowly collected resources in a google doc. In this blog post I want to highlight a few articles that are particularly valuable. If anything piques your interest, the doc likely has more articles and you are welcome to contribute to it as well.
P-values
The American Statistical Associations Statement on P-values and the subsequent issue of The American Statistician provide an excellent overview of common mistakes around p-values. The statement lists six principles, if any of them catch your attention the statement is only three pages long. A small door to a deep rabbit hole.
- P-values can indicate how incompatible the data are with a specified statistical model.
- P-values do not measure the probability that the studied hypothesis is true, or the probability that the data were produced by random chance alone.
- Scientific conclusions and business or policy decisions should not be based only on whether a p-value passes a specific threshold.
- Proper inference requires full reporting and transparency.
- A p-value, or statistical significance, does not measure the size of an effect or the importance of a result.
- By itself, a p-value does not provide a good measure of evidence regarding a model or hypothesis.
Testing Assumptions of Statistical Tests
This article’s title says it all, Are assumptions of well-known statistical techniques checked, and why (not)? “Violations of, or conformance with, the assumptions of normality and homogeneity of variance were correctly checked in 12% and 23%, respectively, of the analyzed data sets.”
Missing Data
Research studies often overlook the bias that missing data can introduce. What is the difference between missing completely at random and missing at random? provides a succinct introduction to the three mechanisms for missing data and their implications for researchers. I really appreciate how this article packs a lot of information into a concise package.
Researcher Flexibility
False-Positive Psychology: Undisclosed Flexibility in Data Collection and Analysis Allows Presenting Anything as Significant provides guidance for reviewers and editors.
- Authors must decide the rule for terminating data collection before data collection begins and report this rule in the article.
- Authors must collect at least 20 observations per cell or else provide a compelling cost-of-data-collection justification.
- Authors must list all variables collected in a study.
- Authors must report all experimental conditions, including failed manipulations.
- If observations are eliminated, authors must also report what the statistical results are if those observations are included.
- If an analysis includes a covariate, authors must report the statistical results of the analysis without the covariate.
Data Visualizations
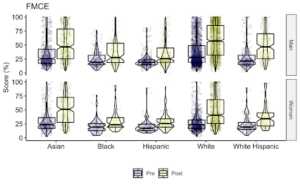
I’ve been adding visualizations of the raw data to the supplemental material for my publications as a tool for allowing readers and reviewers to see if I missed something in checking the assumptions of my statistical tests. It also provides a sense of the size of the data and its distribution across the populations. Show the data, don’t conceal them motivated this change in my practice and ggplot2 enables it.